2021 – 2022 testing of prediction, July 29th 2022
We have prepared the newest results of testing of NevGen Predictor. Time span is from August 1st 2021 to July 10th 2022, little less than year.
As was done in previous years, newly found haplotypes with known deep SNPs are predicted for (their already known) subclade with NevGen Predictor. Statistics of results can be seen on the next eight pictures (four are by number of haplotypes used, and other four by percentages). Haplotypes which do not belong to any of supported subclades (due to small number of available samples) are not used in this statistics. As always, prediction was considered as right if haplotype belongs to subclade which is the first in list (it’s already known subclade has greatest probability), and if it’s probability is greater than 0 (please note that probability do not need to be 100%, but must be the first and must be bigger than 0).
First is for whole of haplogroup R (R1b, R1a and R2), second is for haplogroups I and J, third is for haplogroups E and G and fourth is for N and all other haplogroups. Percentages of right predictions can be compared to prediction rates of previous year.
Like we said before, to avoid confusion, should be noted that statistics is concerned with prediction of deeper subclades (those that NevGen Predictor supports) of mentioned higher-level haplogroups, not for prediction of higher-level haplogroups themselves. For example, I1’s 88.4% of right subclade predictions is for prediction of subclades of I1, not for prediction of I1 alone, which is easy with at least 25 markers. The same holds for all other haplogroups from pictures, like I2a > L38, I2a > Slavic-Carpathian, I2a > Isles, I2a > M223, J1, E > V13, E > M84, N > VL62, N > CTS4329, R1b > M222, R1a M458, C, L, Q, T, D and so on.
Important thing is that all haplotypes which are less than 9/111, 6/67 or 4/37 close to any haplotype which is part of statistics of it’s already known subclade are excluded from this statistics. That way statistics is more reliable, since such close haplotypes are almost always good predicted. Haplotypes with less than 37 markers were not used in this testing, and majority of them had 111 markers.
Level for R1b-M222 used here is not available in public, since we are not satisfied with it’s results. From statistics for R1b-L21 are excluded all haplotypes of M222 and L226, because they are trivial to predict themselves, even on smaller number of markers (but not their deeper subclades).
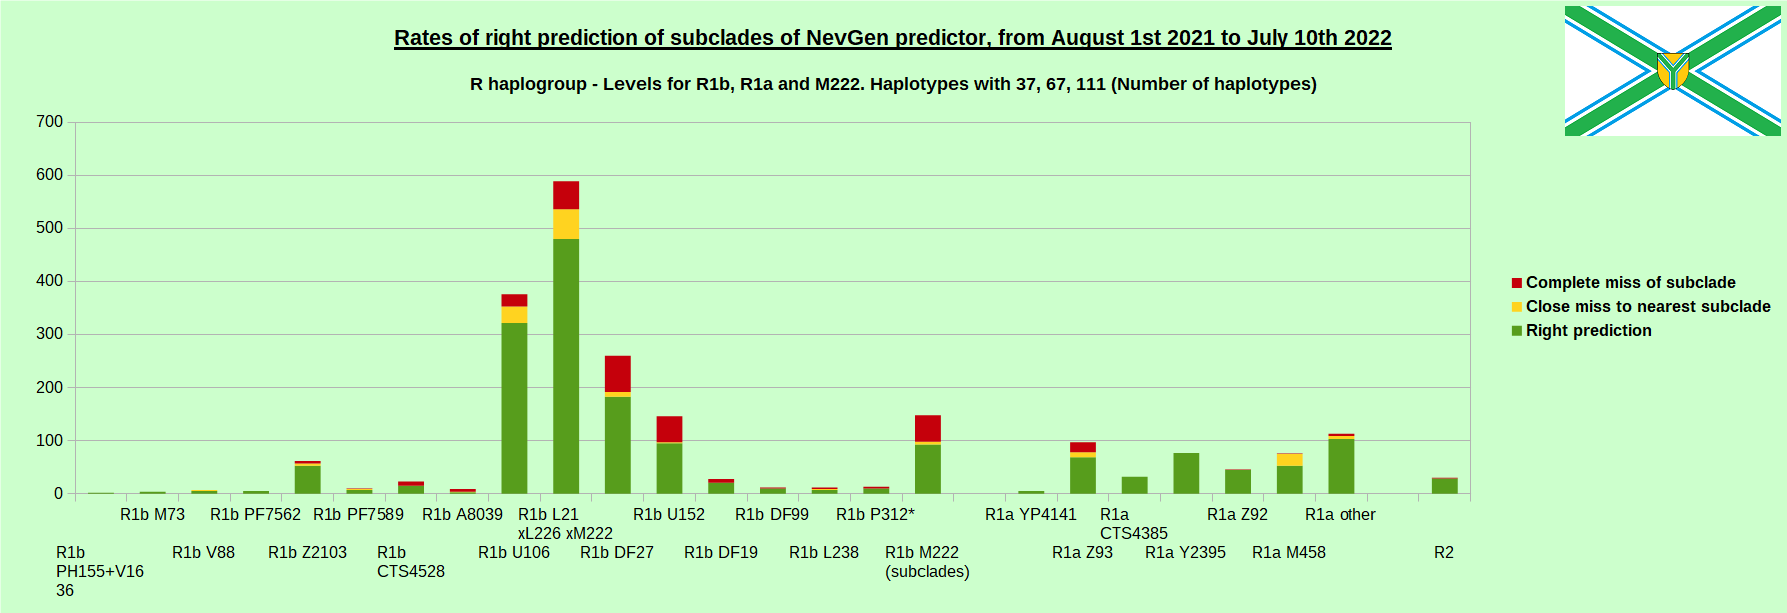

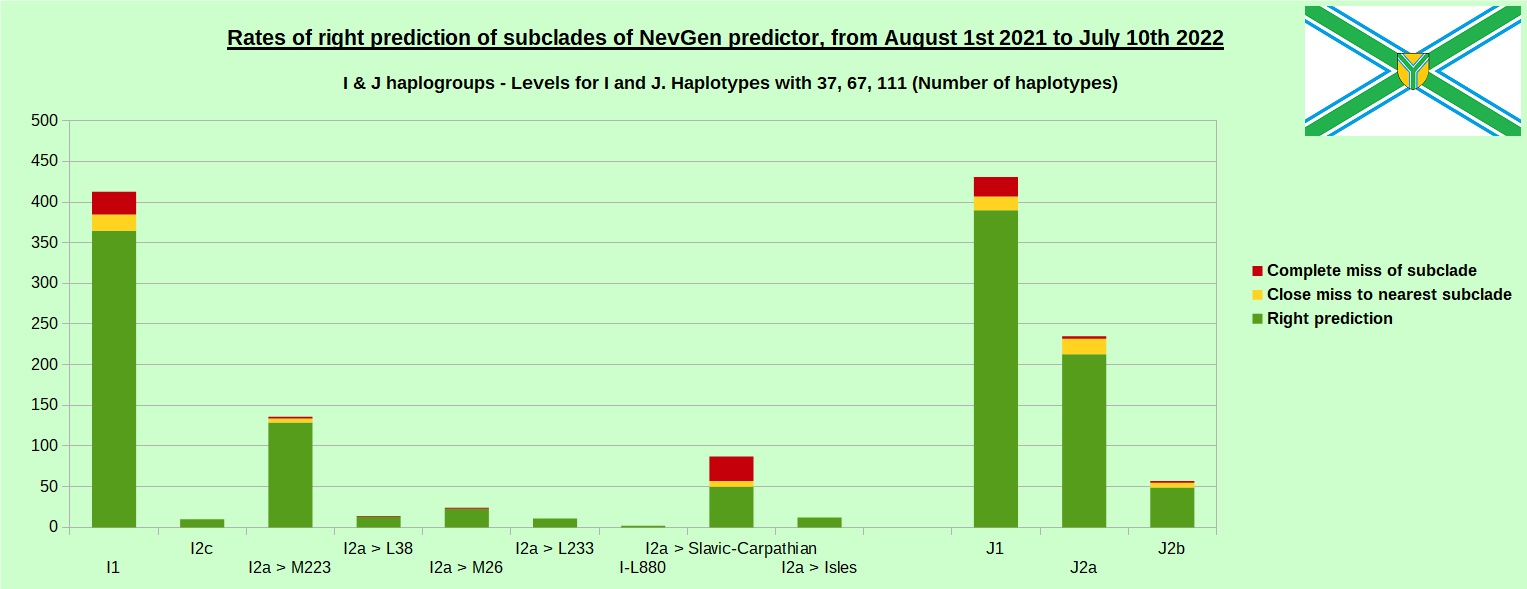
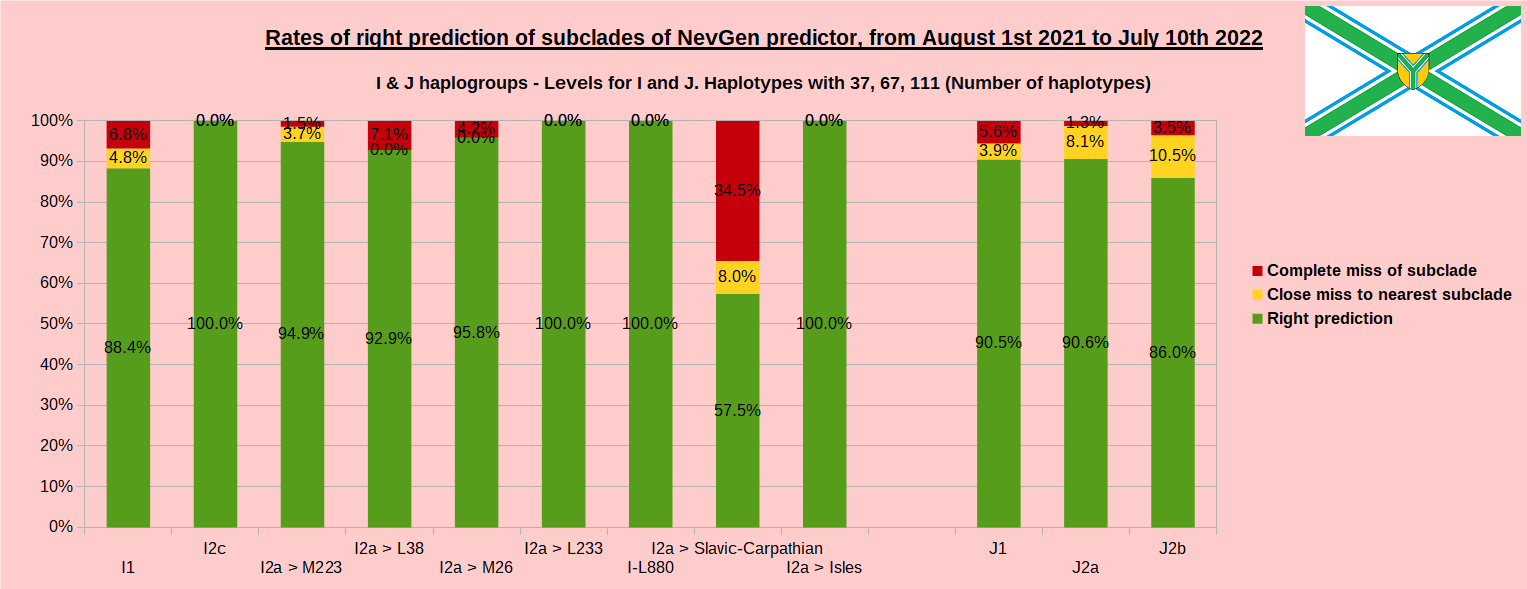
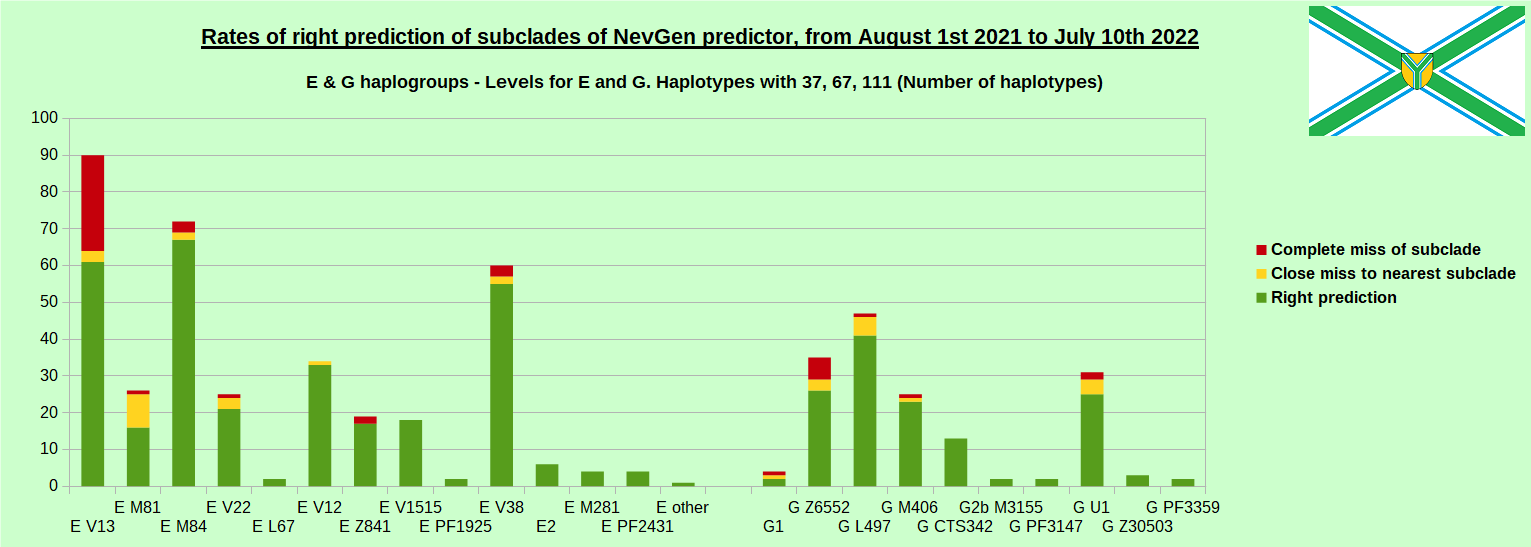
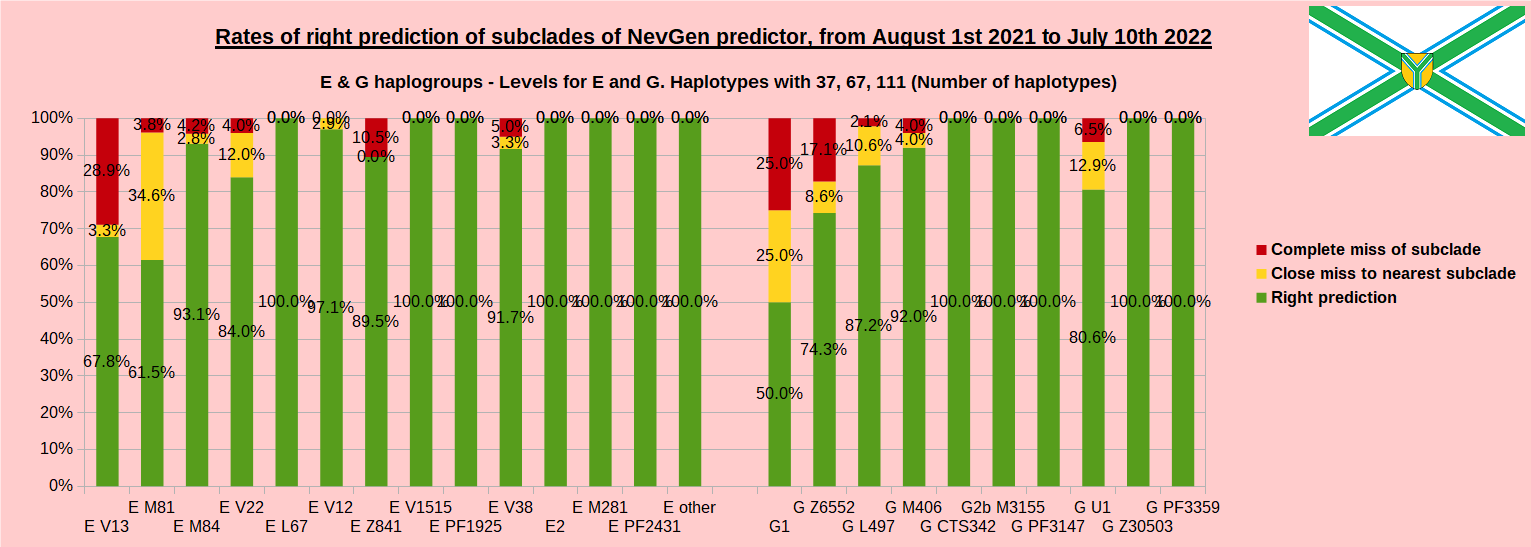
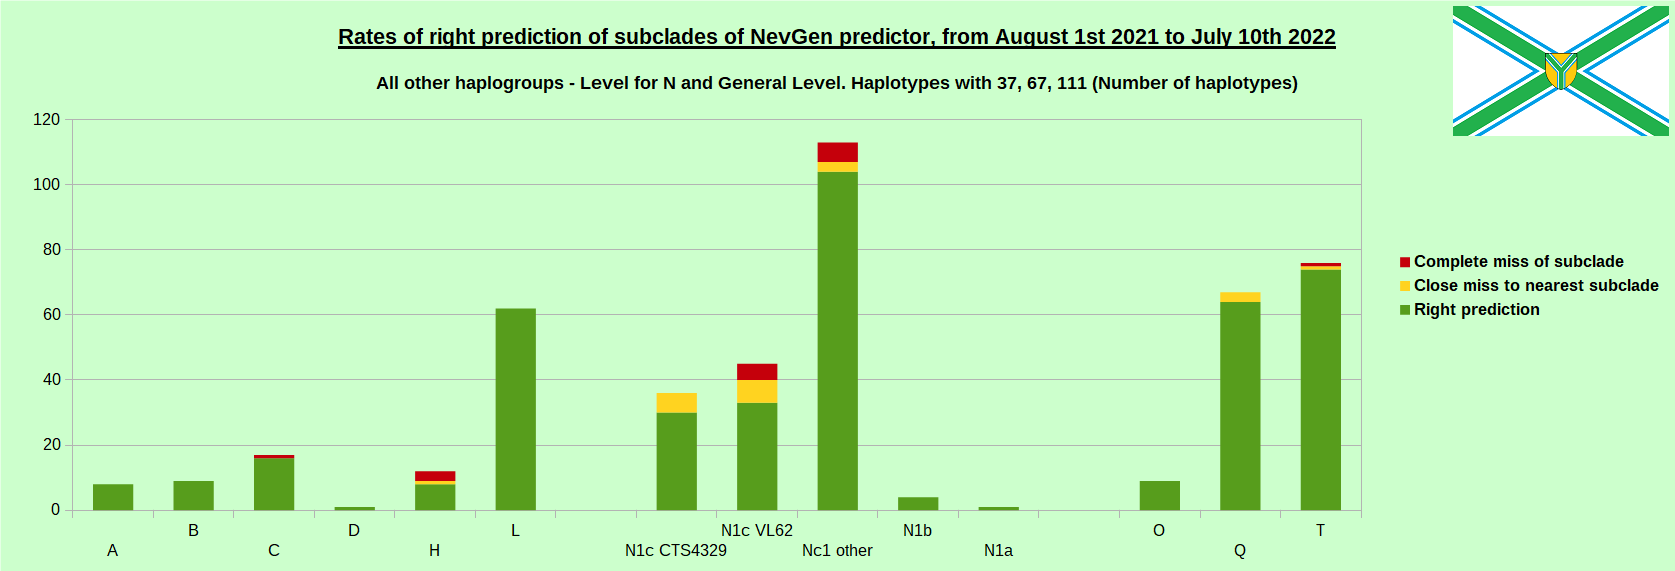
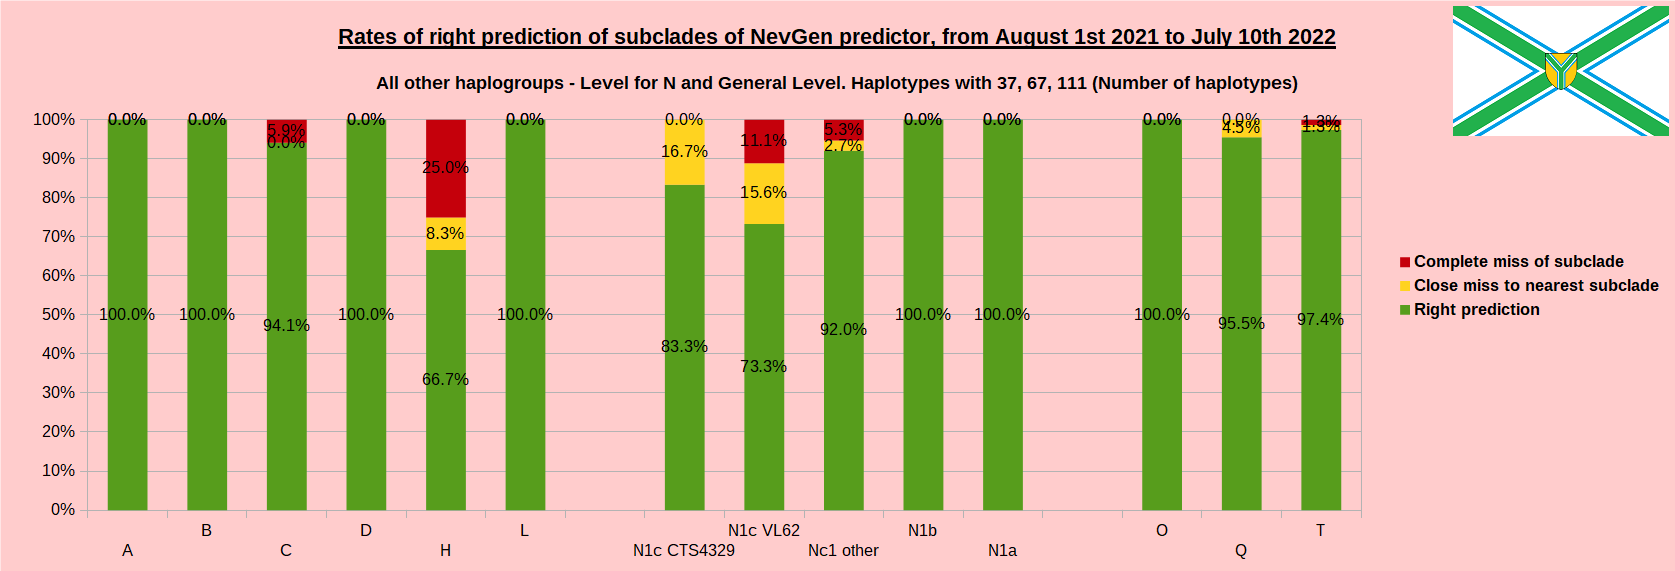
In this year again, the worst prediction rates of major haplogroups are for I2a > Slavic-Carpathian. But this year we have more right predicted than wrong predicted, last year’s results for this haplogroup were worse. This year second place as the worst prediction results are again for R1b-U152, 65.1% (two years ago it was the worst), better than last year’s 59.5%. I still believe we need many hundreds (if not thousands) of new haplotypes to get satisfying results for U152.
Like in the previous years, with yellow colour we have marked haplotypes which got the most of probability to subclade which is very close, one level below. For example, if our haplotype is by SNP proven to belong to “R1b U106>Z381> Z301>L48> Z9>>Z326>> A5011”, but we got top probability in NevGen for “R1b U106>Z381> Z301>L48> Z9>>Z326>> BY4305”, we than record this testing as “close miss”.
From our experience, subclades under L1335 and FGC11134 (R1b > L21), are not easy to be distinguished, and also Z326 under U106 or L1029 (R1a > M458) or under L258 (I1), and under N-VL62 and N-CTS4329, just to mention some of them.
When comparing with results of previous year, we can see that in many major haplogroups percentages of right-predicted haplotypes increased significantly. Main reason for that is the bug in data organisation which I found and fixed last autumn. In some haplogroups percentages decreased significantly, G-U1 and E-V38, but reason for that is that they were in meantime heavily divided into deeper subclades, which makes prediction harder, so their results of those years are not comparable. Here you can see some of improvements:
- R1a Z93: 51.1% => 71.1%
- R2: 76.2% => 96.7%
- I1: 75.8% => 88.4%
- R1b DF27: 60.5% => 70.4%
- R1b L21: 76.0% => 81.5%
- R1b U152: 59.5% => 65.1%
- R1b U106: 82.4% => 85.6%
- I2a L621 Slavic-Carpathian: 42.3% => 57.5%
- R1b M222: 53.3% => 62.8%
- R1a M458: 58.2% => 69.7%
- I2 M223: 88.8% => 94.9%
- G L497: 76.3% => 87.2%
We also tested new feature in prediction, added in August 2021. It is possibility to predict even deeper subclades in some haplotypes, by recognition of STR signature (of length from 1 up to 5 markers) which is typical for deeper subclade, but not for its parent subclade which is available in the list. Out of 4601 haplotypes used in testing, such deeper subclade predictions were available in 1008 cases, which makes 21.9%. We give its results here by length of STR signature:
Out of 228 found STR signatures of length 5, 224 were right (proven by SNP), which gives success rate 98.25%.
Out of 248 found STR signatures of length 4, 232 were right, which gives success rate 93.55%.
Out of 369 found STR signatures of length 3, 323 were right, which gives success rate 87.53%.
Out of 76 found STR signatures of length 1, 70 were right, which gives success rate 92.1%.
Out of 297 found STR signatures of length 2, only 188 were right, which gives success rate of 63.3% This are worst results of all STR signature lengths, I must do something to better filter them, to get more reliable predictions.
Please beware that sum of previous does not need to add to 1008, because for some haplotypes more than one STR signature has been found, and some signatures could not be checked because of missing deeper SNPs.
STR signatures are recognized in all haplogroups and can be found in most of clades, but more often in clades which are older, because their descendants have more diverse and structured haplotype STR values. Here is the list of number of found deeper STR signatures by main haplogroups:
- B: 4/9 = 44.44%
- L: 25/62 = 40.32%
- Q: 21/67 = 31.34%
- J2: 89/292 = 30.48%
- T: 23/76 = 30.26%
- E: 104/363 = 28.65% (V13: 10/90, M84: 20/72, M81: 6/26, V12: 18/34 = 52.94% !!!!, V22: 8/25)
- R2: 7/30 = 23.33%
- R1b: 358/1706 = 20.98% (U106: 81/376, L21: 136/589, M222: 15/148, U152: 28/146, Z2103: 18/62, DF27: 45/260)
- I1: 84/413 = 20.34%
- N: 40/199 = 20.1%
- I2: 59/296 = 19.93% (M223: 37/136, CTS10228 Slavic-Carpathian: just 2/87 = 2.3%!)
- J1: 84/431 = 19.49%
- R1a: 80/446 = 17.94%
- C: 3/17 = 17.65%
- G: 25/164 = 15.24% (L497: 9/47)


Hi you must get bothered with this all the time but I like many others tried the Ramses thing. I just read your explanation of it. What do you think of the Whit Athey predictor result? Is it equally invalid or did they have more than the published data perhaps?