NevGen’s coefficients of fitting of subclade into another subclade
(last updated on January 10th, 2018.)
Experienced genetic genealogists know that haplotypes of some subclades are relatively easy to be confidently predicted on some set of markers. For example, haplotypes belonging to R1b subclades L226 and M222 are easily recognisable even on 37 markers, and accordingly haplotypes of those two subclades are easy to distinguish from haplotypes of any other R1b subclades. But it is well known fact that in general R1b subclades are not easy to distinguish on 67 or often even with 111 markers. Already is also known fact that in general R1a subclades are easier to distinguish (to be predicted) than R1b subclades on any set of markers.
We tried to formalize relation of “similarity” (or it’s inverse, “distinguishability”) of two clades on any set of markers in NevGen predictor. Or, in other words, to calculate some coefficient which measures NevGen’s capability to distinguish one clade from another on any predefined set of markers. Code for it was designed in August 2017. Result of it is numerical measurement named “fitting coefficient of Subclade A into statistics of Subclade B”. First thing needed to note here is that this is not simetric: fitting of Subclade A into Subclade B is not the same thing as fitting of Subclade B into Subclade A. Fitting coefficient measures how average representative of Subclade A fitts into statistics of Subclade B. If it fitts more, than Subclade A is harder to distinguish from Subclade B. So, predictor can give more reliable predictions if fitting coefficients are lower.
Now we shall try to explain how fitting coefficient of Subclade A into Subclade B is calculated. Haplotypes used for it are all those available in training data set for each subclade which contain predefined set of markers, but they are previously distorted by randomly changing them through 20 generations (this way we get artificial descendants, several of them for each original haplotype). This way we get greater fitting coefficients which are more realistic for unknown haplotypes, those which are not part of our training data set. For all such distorted haplotypes of both subclades A and B we calculate fitness scores into statistics of Subclade B.
Then for every used haplotype from Subclade A we find percentage of used haplotypes from Subclade B which has lower fitness score into statistics of Subclade B. We find average of such percentages for all used haplotypes from Subclade A, multiply it with 2, and what we get is final fitting coefficient of Subclade A into statistics of Subclade B, in range [0, 1]. This kind of calculation is maybe not the most scientific, but it is simple and easy for implementation and understanding.
Now let see some samples, with fitness scores distribution in range from 0 to 100. First goes fitting of R1a haplotypes into R1b statistics in NevGen’s General Levels (from R1a and R1b are excluded some very old subclades, like YP4141, YP1272, V88, V1636, PH155… which does not change results much), together with fitting coefficients. We can see it on six different markers sets.
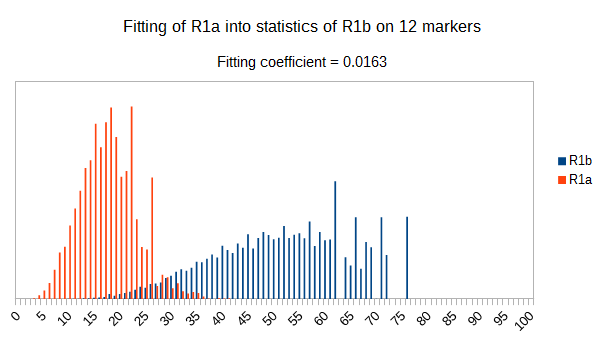
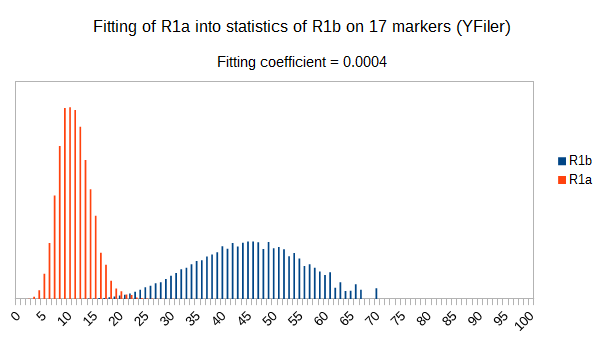
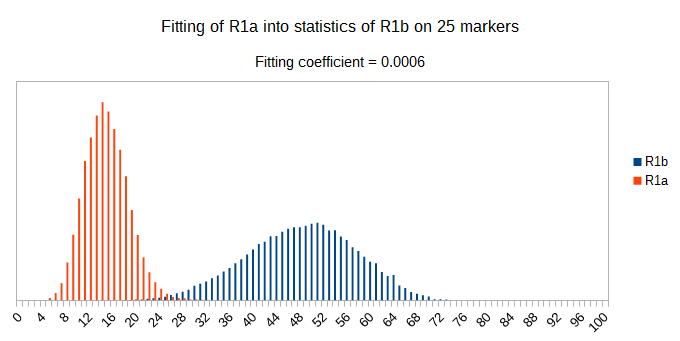
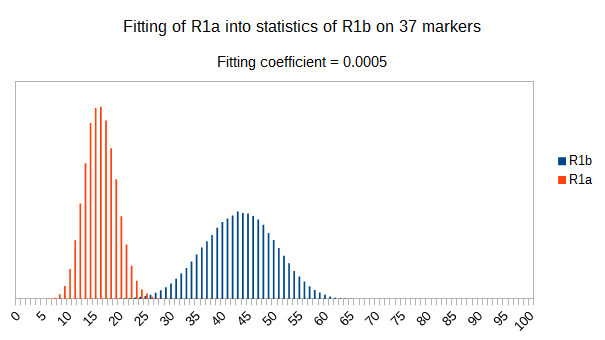
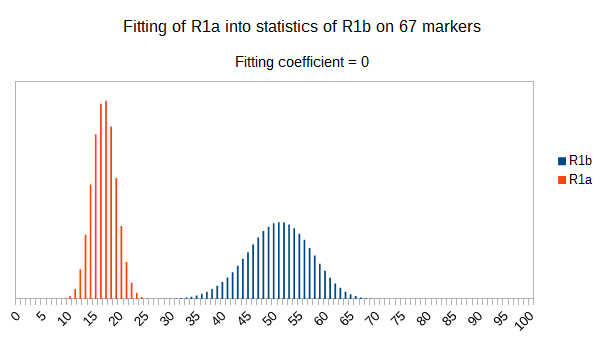
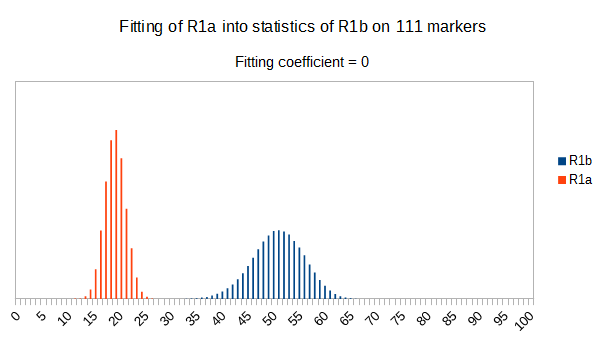
As we can see from five FTDNA marker sets, more markers means lower fitting coefficients, which means greater discrimination power. As is expected. On first four markers sets (up to 37 markers), there is small overlapping of fitness scores of R1a and R1b samples into R1b statistics. It diminishes on 67 and 111 markers.
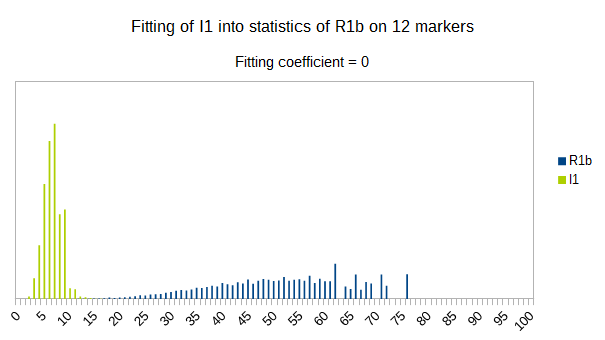
I1 fitts less than R1a into statistics of R1b, it’s fitting coefficient is 0. Again as expected, since it is more far away in time from it than R1a is.
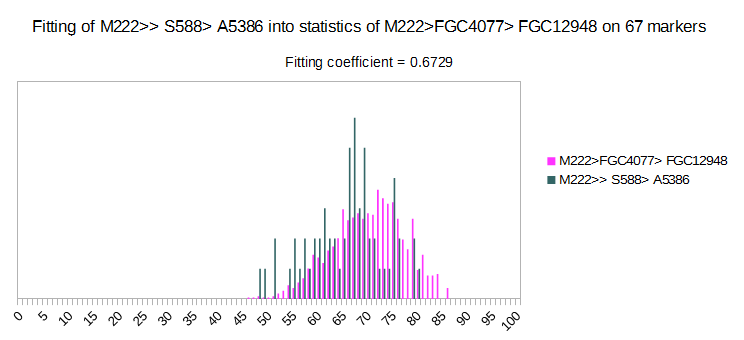
Now we have two deep subclades of R1b > M222, with very high fitting coefficient on 67 markers set. On picture we can see that two of it much overlap, so it is hard to distinguish among them. Generally, it is very hard to distinguish among subclades of M222. Experimental Level was made only for M222, with 46 subclades (some of them are parasubclades, like DF85, DF97, S568…), based on about 450 haplotypes. Results are not satisfying, and average fitting coefficients are 0.1328 for 67 markers, and 0.05847 for 111 markers, which is very high. Many more deep SNP defined haplotypes are needed in order predictions of subclades of M222 to be reliable. It is reason why this M222 Level is not available.

Although subclade U106 > S6989 is of similar age like subclade M222, subclades of S6989 are much easier to differentiate than subclades of M222. We can see here one example of it, with much lower fitting coefficient on the same set of markers.
Fitting coefficients highly depend of NevGen’s algorythm and parameters, but also depend on division of haplotypes into subclades. With division of available haplotypes into more subclades it is expected fitting coefficients to be lower in average, which makes prediction more reliable. Also should be noted that fitting coefficients are calculated on basis of known haplotypes. We do not know how shall behave unknown haplotypes which could be very far from all to us known haplotypes which belong to the same subclade.
Here can be downloaded tables of fitting coefficients, for all levels available in predictor. This shall be refreshed from time to time. We need only to describe what columns mean. This is short sample from statistics on 67 markers of one of subsections in Level R1b.
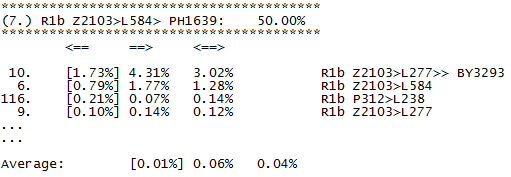
We see here part of subsection for subclade PH1639. First column is nothing more than ordinal number of other subclade in level. Second column (in brackets, data is ordered by it) holds fitting coefficient of subclade named in row into subclade in subsection, for example first row says that fitting coefficient of subclade BY3293 into statistics of PH1639 is 0.0173 (in table it is given in percentages). Third column holds opposite fitting coefficient, in the same row it is fitting coefficient 0.0431 of PH1639 into statistics of subclade BY3293. Fourth column is just average of second and third column. At the end of subsection (which is here for simplicity shortened to just first four rows) we have averages of all three coefficients.


